Saturday, July 10, 2010
Friday, July 9, 2010
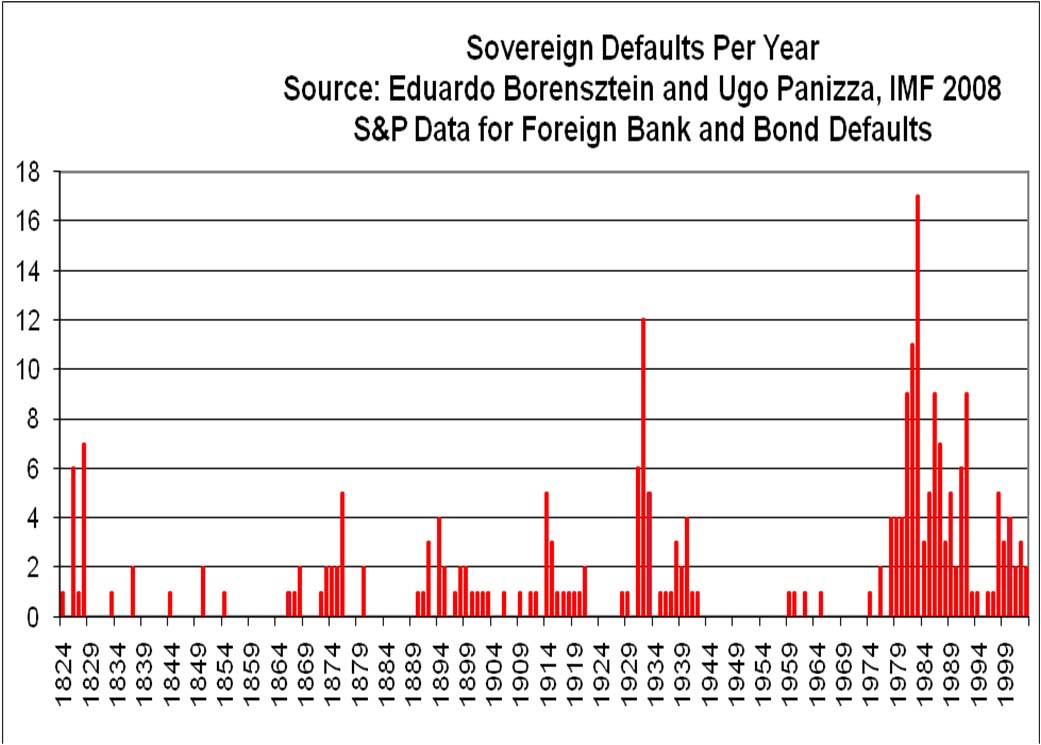
Sovereign Defaults per Year
 |
Sovereign Defaults 1820 to 1920
 |
Sovereign Defaults 1921 to 1980
 |
Sovereign Defaults 1981 to 2003
 |
Unofficial Problem Bank List July 9, 2010
Class: from FDIC
The FDIC assigns classification codes indicating an institution's charter type (commercial bank, savings bank, or savings association), its chartering agent (state or federal government), its Federal Reserve membership status (member or nonmember), and its primary federal regulator (state-chartered institutions are subject to both federal and state supervision). These codes are:Cert: This is the certificate number assigned by the FDIC used to identify institutions and for the issuance of insurance certificates. Enter the number at the Institution Directory (ID) system "will provide the last demographic and financial data filed by the selected institution". See Calculated Risk Post: Unofficial Problem Bank List at 796 InstitutionsN National chartered commercial bank supervised by the Office of the Comptroller of the Currency SM State charter Fed member commercial bank supervised by the Federal Reserve NM State charter Fed nonmember commercial bank supervised by the FDIC SA State or federal charter savings association supervised by the Office of Thrift Supervision SB State charter savings bank supervised by the FDIC
Thursday, July 8, 2010
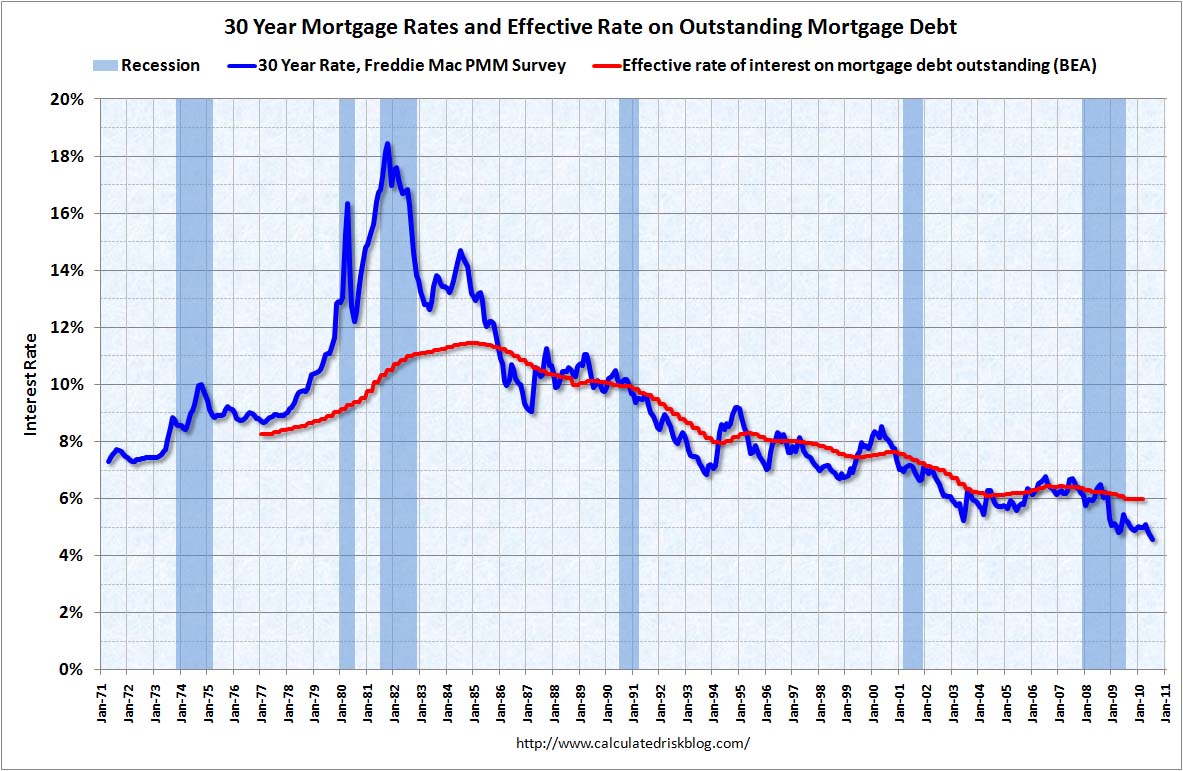
Mortgage Rates and Effective Rate on Outstanding Mortgages July 2010
 |
Sovereign Debt compared to Equities and Other Debt
 |
Sovereign Debt December 2009
 |
Sovereign Debt as Percent of GDP December 2009
 |
Weekly Initial Unemployment Claims July 8, 2010
 |
Wednesday, July 7, 2010
Refinance Activity and Mortgage Rates July 2010
 |
MBA Purchase Index July 7, 2010
 |
Tuesday, July 6, 2010
Table Long Term Unemployed
| Education Level | % of Labor Force at that education level | % of Unemployed at that education level | % of Long-term unemployed at that education level | Average (mean) length of unemployment at that education level in weeks | ||||||||
|---|---|---|---|---|---|---|---|---|---|---|---|---|
| Age | ALL (25+) | 25 to 44 | 45+ | ALL (25+) | 25 to 44 | 45+ | ALL (25+) | 25 to 44 | 45+ | ALL (25+) | 25 to 44 | 45+ |
| No High School | 8.8% | 9.7% | 7.9% | 16.8% | ?(2) | ? | 15.3% | 17.6% | 12.9% | 30.0 | 28.3 | 32.9 |
| High School | 29.1% | 27.5% | 30.9% | 38.0% | ? | ? | 38.6% | 38.8% | 37.3% | 32.3 | 30.1 | 35.2 |
| Some College(1) | 27.6% | 27.9% | 27.2% | 26.4% | ? | ? | 26.8% | 27.2% | 26.4% | 32.8 | 30.1 | 36.4 |
| BA or higher | 33.6% | 34.9% | 33.9% | 18.8% | ? | ? | 19.8% | 16.4% | 23.4% | 32.8 | 29.2 | 36.2 |
ISM Non-Manufacturing Index June 2010
 |
Office Vacancy Rate Q2 2010
 |


