Archive of Images and Tables
About
|
Home
|
Calculated Risk blog
Monday, May 3, 2010
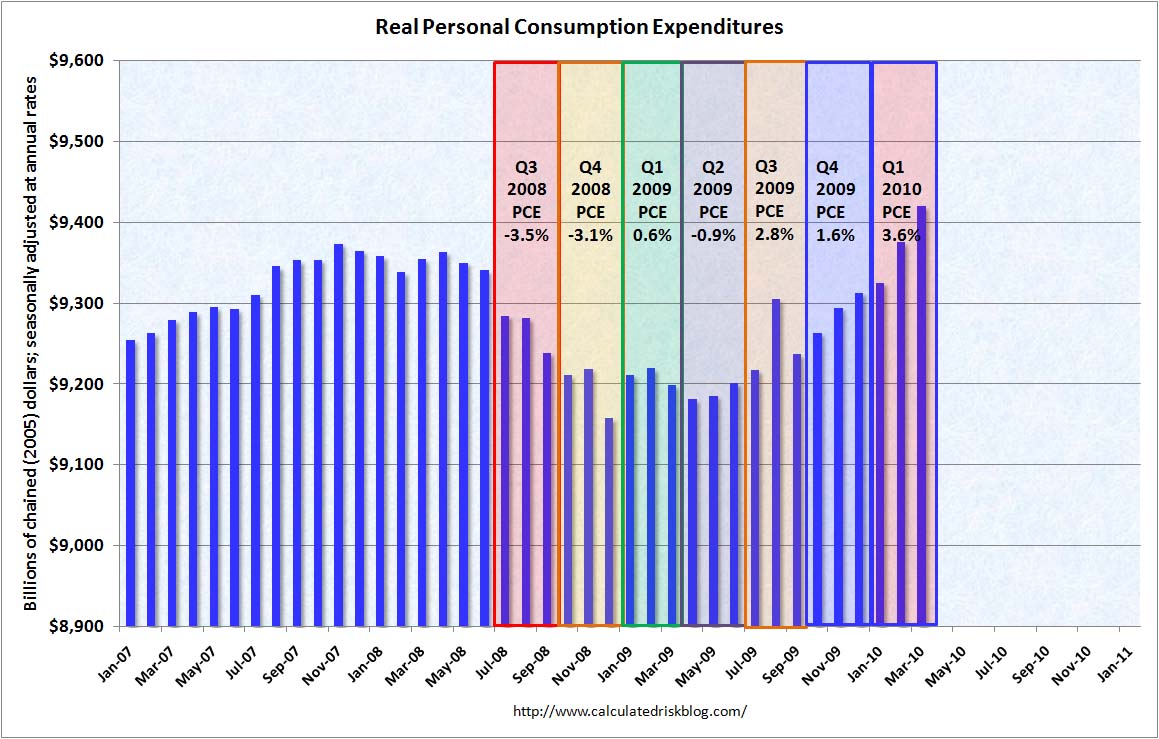
PCE March 2010
See Calculated Risk Post:
March Personal Income up 0.3%, Spending Increases 0.6%
Image Archive
►
2011
(52)
►
06/19 - 06/26
(2)
►
06/12 - 06/19
(2)
►
06/05 - 06/12
(2)
►
05/29 - 06/05
(1)
►
05/22 - 05/29
(5)
►
05/15 - 05/22
(4)
►
05/08 - 05/15
(1)
►
05/01 - 05/08
(2)
►
04/24 - 05/01
(3)
►
04/17 - 04/24
(2)
►
04/10 - 04/17
(4)
►
04/03 - 04/10
(2)
►
03/27 - 04/03
(5)
►
03/20 - 03/27
(1)
►
03/13 - 03/20
(2)
►
03/06 - 03/13
(2)
►
02/27 - 03/06
(2)
►
02/20 - 02/27
(1)
►
02/13 - 02/20
(1)
►
02/06 - 02/13
(1)
►
01/30 - 02/06
(2)
►
01/23 - 01/30
(1)
►
01/16 - 01/23
(1)
►
01/09 - 01/16
(1)
►
01/02 - 01/09
(2)
▼
2010
(845)
►
12/26 - 01/02
(2)
►
12/12 - 12/19
(1)
►
12/05 - 12/12
(1)
►
11/28 - 12/05
(2)
►
11/21 - 11/28
(1)
►
11/14 - 11/21
(2)
►
11/07 - 11/14
(1)
►
10/31 - 11/07
(12)
►
10/24 - 10/31
(40)
►
10/17 - 10/24
(23)
►
10/10 - 10/17
(20)
►
10/03 - 10/10
(22)
►
09/26 - 10/03
(22)
►
09/19 - 09/26
(30)
►
09/12 - 09/19
(23)
►
09/05 - 09/12
(19)
►
08/29 - 09/05
(34)
►
08/22 - 08/29
(24)
►
08/15 - 08/22
(29)
►
08/08 - 08/15
(22)
►
08/01 - 08/08
(30)
►
07/25 - 08/01
(28)
►
07/18 - 07/25
(31)
►
07/11 - 07/18
(32)
►
07/04 - 07/11
(21)
►
06/27 - 07/04
(36)
►
06/20 - 06/27
(28)
►
06/13 - 06/20
(24)
►
06/06 - 06/13
(23)
►
05/30 - 06/06
(25)
►
05/23 - 05/30
(31)
►
05/16 - 05/23
(31)
►
05/09 - 05/16
(22)
▼
05/02 - 05/09
(29)
Duration of Unemployment, April 2010
Unofficial Problem Bank List May 7, 2010
Apartment Tightness Index April 2010
Temporary Help April 2010
Employment Diffusion Index April 2010
Unemployed Over 26 Weeks April 2010
Part Time Workers April 2010
Employment Population Ratio April 2010
Employment and Recessions April 2010
Employment Measures April 2010
S&P 500 May 6, 2010
Personal Income and Transfer Payments
Weekly Initial Unemployment Claims May 6, 2010
Gulf Oil Spill May 5 2010
MBA Purchase Index May 5, 2010
Residential Investment Components Q1 2010
Personal Bankruptcy Filings April 2010
Light Vehicle Sales 11.21 million SAAR April 2010
Light Vehicle Sales April 2010
Lodging Investment Q1 2010
Office Investment Q1 2010
Mall Investment Q1 2010
Construction Spending YoY March 2010
Construction Spending March 2010
Personal Saving as Percent of Disposable Personal ...
Personal Income less Transfer Payment March 2010
PCE March 2010
IMF List of Large Fiscal Adjustments
Updated: Fed Rent-to-House Prices Graph
►
04/25 - 05/02
(25)
►
04/18 - 04/25
(29)
►
04/11 - 04/18
(30)
►
04/04 - 04/11
(8)
►
03/28 - 04/04
(17)
►
03/21 - 03/28
(11)
►
03/14 - 03/21
(3)
►
02/28 - 03/07
(1)
Architecture Billings Index
(2)
auto
(9)
Bankruptcy Filings
(5)
Capacity Utilization
(2)
Cartoon
(1)
Commercial Real Estate
(10)
Construction Spending
(8)
CRE
(32)
credit indicators
(3)
Delinquency Rate
(11)
Demographics
(2)
employment
(73)
European Data
(1)
Existing Home Sales
(40)
FDIC
(19)
Fed Funds Rate
(3)
Flow of Funds
(3)
Foreclosure
(6)
GDP
(18)
Homeownership and Vacancy Rate
(3)
House Prices
(42)
Housing Starts
(26)
Industrial Production
(2)
Industry Indicator
(1)
manufacturing
(1)
MBA
(3)
MBA Mortgage
(20)
MEW
(1)
Modifications
(4)
Mortgage Debt
(2)
Mortgage Rates
(7)
NAHB Builder Confidence
(11)
Negative Equity
(6)
New
(1)
New Home Sales
(25)
Oil Prices
(2)
Recession Measures
(8)
Rental Market
(3)
REO
(9)
Residential Investment
(6)
Retail Sales
(12)
Saving Rate
(1)
Short Sale
(6)
Stock Market
(8)
Trade Balance
(14)
transportation
(16)
Unemployment Claims
(1)
Unofficial Problem Bank List
(21)
Vehicle Miles
(5)
Vehicle Sales
(8)